By Mark Nanyingi (Infectious disease epidemiologist & Pharmacotoxicologist, University of Liverpool)

As the Kenyan government continues to find more cases of COVID-19, test more people and trace those who were in contact with infected people, the number of COVID-19 cases in Kenya is expected to change.
For the government to successfully manage the pandemic, it needs to understand how the virus that causes the disease is transmitted and whether mitigation measures are effective.
Because it takes time to get data about what is happening in reality, infectious disease models can be a useful guide to help authorities prepare and respond. They provide insights into what might happen.
Essentially, models can help to interrupt the transmission of viruses by predicting where transmission is likely to happen and public communication on the risks. Then controls can be put into place.
It’s important that these are quickly established. COVID-19 is estimated to have a crude mortality ratio (the number of reported deaths divided by the reported cases) of between 3% and 4%. This has been shown to be different in some countries. Discrepancies may arise because cases haven’t been reported or due to a lack of testing.
For Kenya, this implies that – in the worst case scenario – 40 people may die for every 1,000 confirmed cases if no intervention is put in place.
To my knowledge, it’s not clear which models are being used by the Kenyan government, their data sharing protocols lack transparency and therefore there is also uncertainty over the status of the disease within the country.
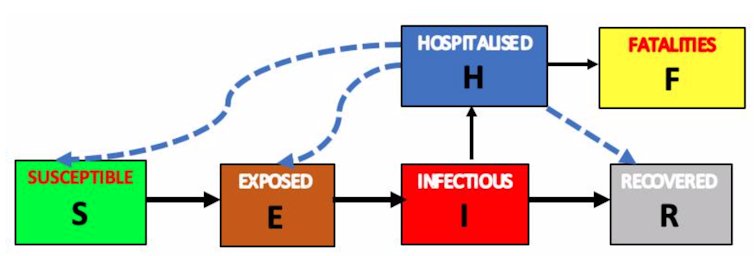
There are various infectious disease models, one of which is the SEIR model. The model – first described by mathematicians in 1969 – looks at four factors, people that are: Susceptible, Exposed, Infectious, Recovered. It is an extension of the classical SIR (Susceptible, Infected, Recovered) model, originally developed in 1927. The SEIR model adds a fourth compartment: exposed persons which are infected but are not yet infectious.
The model was recently used for COVID-19 in Wuhan, the Chinese city where the disease first broke out. It helped to outline the interventions needed to reduce the number of people at risk of catching the virus. SEIR models were also used to predict interventions during the 2009 influenza pandemic in the US.
Modelling the response
The SEIR model looks at the flow of people between four phases: susceptible (S), exposed (E), infected (I), and recovered or removed (R).

It also examines how fast people move from being susceptible to exposed, from exposed to infected, and from infected to recovered. It supports public health preparedness and response planning by improving surveillance, giving an indication of how feasible it would be to contain the virus and where resources should be prioritised once a pandemic begins.
This is a popular model for pandemics because it provides realistic scenarios on the transmission patterns of the disease while predicting the effectiveness of different interventions.
To create a SEIR model that predicts the risk and spread, a few pieces of data are needed.
S is for susceptible: Since the virus is new, we assume that all people in Kenyan households are susceptible, putting them at risk of infection.
E for exposed: This is the population that may be exposed and incubating the disease but may not show signs – also called asymptomatic.
I for infected: Then we need to figure out how many people an infected person can infect. This is called the basic reproduction number. It includes information on how many days they are infectious, the number of people the infected person has come into contact with over a period of time, and the rate at which people become infected. An epidemic continues if the basic reproduction number is higher than one. In other words, each person is infecting more than one other person.
A recent study in Wuhan estimated that the reproduction number for COVID-19 was 3.58. This means, on average, an infected person can infect four other people. Since Kenya’s population lacks immunity to COVID-19 at this stage, we assume it would be the same.
R for recovered or removed: The hospitalisation of patients and enforcement of restrictions will slow the spread of disease, lead to recovery and possible “herd immunity” or resistance in the population.
The data from SEIR models can be supported by maps to indicate “hotspots”. When fitted with daily cases, deaths and recoveries, these highlight areas where the risk of spread is high or likely. They can inform decisions on where interventions should happen, and at what scale.
Challenges
In Kenya, the health ministry is responsible for gathering data on COVID-19 cases. The Integrated Disease Surveillance and Response teams collect surveillance and laboratory data based on possible cases and contact tracing. The National Emergency Response Committee on Coronavirus is mandated with overall coordination.
However, during pandemics there are some big challenges in putting together these models, like missing data.
In Kenya’s case, the actual number of infected patients may differ from the number of reported cases due to weaker surveillance systems, poor contact tracing and active case detection, slow testing and clinical diagnosis. There’s also the additional challenge, in the case of this pandemic, of people who don’t show symptoms.
The scarce data available is also currently only on infected and recovered categories. There is an urgent need for serological tests. These find antibodies in the blood – molecules made by the immune system in response to a pathogen’s attack – and would measure how much the virus spread and how many people recovered.
Once we have this information, the model can play a key role in the control of the pandemic, informing key decision-making.
This article is republished from The Conversation: https://theconversation.com/predicting-covid-19-what-applying-a-model-in-kenya-would-look-like-134675

